Contents

Telecomunicazioni Industria
The Practical Guide to Surface Science (2026)

?s=100&d=m
Written by
No biography added yet.
Read More
?s=100&d=m
Reviewed by
N/A
No biography added yet.
Read More
?s=100&d=m
Written By

No biography added yet.

?s=100&d=m
Reviewed By

N/A N/A

No biography added yet.

This is a practical guide to Surface Science for researchers working in the Telecommunications Industry.

In this all-new guide you’ll learn all about:

  • Crucial surface science principles
  • The significance of surface science measurements for the Telecommunications industry
  • Applicable ASTM Standards & Guidelines

Let’s dive right in.

telecom

Executive Summary

What it covers: A practical surface-science playbook for Telecommunications R&D and manufacturing, focused on how to measure and use contact angle, surface tension (including dynamic), surface energy, and sliding angle to improve real telecom components. It connects these measurements to field challenges like wet-weather performance, icing, contamination, and environmental wear.
Key insights: Real telecom surfaces often show contact angle hysteresis, so advancing/receding (dynamic) angles give a more complete and repeatable view than a single static value, especially for adhesion, cleanliness, roughness, and homogeneity. Method choice matters: Young–Laplace typically yields more consistent results but assumes an axisymmetric drop, while polynomial fitting can handle non-axisymmetric drops but is more sensitive to local imperfections; dynamic surface tension is essential when interfaces change quickly (droplet/bubble formation, foams, drying/coating processes).
Business value: Measurement-driven coating and material optimization can reduce rain-related signal attenuation and limit ice/snow adhesion on antennas and dishes (via high contact angle and low sliding angle), improving uptime and performance in harsh climates. Surface-property targets also support more water-resistant cable insulation (reducing water ingress risk) and easier-to-clean outdoor cabinets (less soil/mud adhesion), cutting maintenance burden and reliability failures.
Standards to follow: Use the Conformal Coating Readiness Guideline (≥38 dyn/cm, i.e., ≥38 mN/m) as a repeatable pre-coating QC gate by standardizing fixed-time contact angle and/or computed surface free energy (SFE) measurements taken immediately before coating within a defined timing window. Follow the reporting discipline in the guide (defined PCB zones and sampling map, probe liquids, drop volume, capture timestamp, replicate statistics like median + IQR, SFE method if used, and a clear pass/fail disposition), and validate the threshold against your specific board materials, cleaning/plasma steps, and coating chemistry.
Bottom line: In telecom hardware, surface measurements aren’t academic—they’re practical controls that translate into better wetting/adhesion, better environmental protection, and more reliable performance in rain, humidity, ice, and dirt. A disciplined, documented measurement SOP—especially for pre-coating readiness—turns wettability, SFE, surface tension, and sliding angle into actionable quality and durability gains.

Chapter 1: Introduction

In today’s world, telecommunications system can be characterized by voice, data, and video networks. This sector is continuously enabling global connectivity, facilitating information exchange, and driving economic growth. Extending the life of crucial components like outdoor antennas and safeguarding cables from environmental damage are some major challenges faced by this sector. And in this regard surface properties, which plays crucial role in the interaction between different materials and their surroundings, becomes very important.

We use the following surface properties to understand the behavior of Telecommunications products and improve their quality.

Chapter 2: Contact Angle Measurement

The contact angle quantifies the wettability of a surface by representing the angle between a liquid’s surface and a solid surface.
Dropletlab Research

Sample Image taken from Droplet Lab Tensiometer.

Young – Laplace Method

Metodo polinomiale

Dynamic Contact Angle

Ideally, when we place a drop on a solid surface, a unique angle exists between the liquid and the solid surface. We can calculate the value of this ideal contact angle (the so-called Young’s contact angle) using Young’s equation. In practice, due to surface geometry, roughness, heterogeneity, contamination, and deformation, the contact angle value on a surface is not necessarily a single consistent value but rather falls within a range. The upper and lower limits of this range are known as the advancing and receding contact angles, respectively. The values of advancing and receding contact angles for a solid surface are highly sensitive to many parameters, such as temperature, humidity, homogeneity, and minor contamination of the surface and liquid. For example, the advancing and receding contact angles of a surface can differ at different locations.

Dynamic Contact Angle versus Static Contact Angle

Practical surfaces and coatings naturally show contact angle hysteresis, indicating a range of equilibrium values. When we measure static contact angles, we get a single value within this range. Solely relying on static measurements poses problems, like poor repeatability and incomplete surface assessment regarding adhesion, cleanliness, roughness, and homogeneity.

In practical applications, we need to understand how easily a liquid spreads (advancing angle) and how easily it is removed (receding angle), such as in painting and cleaning. Measuring advancing and receding angles offers a holistic view of liquid-solid interaction, unlike static measurements, which yield an arbitrary value within the range.

This insight is crucial for real-world surfaces with variations, roughness, and dynamics, aiding industries like cosmetics, materials science, and biotechnology in designing effective surfaces and optimizing processes.

Learn how Contact Angle measurement is done on our Tensiometer

For a more complete understanding of Contact Angle measurement, read our Contact Angle measurement: The Definitive Guide

Open Benchmark Data: Contact Angle & Surface Energy

These reference measurements show how deionized water wets four standard substrates measured with the Droplet Lab Dropometer. Use them as visual and numerical benchmarks when you're checking your own sample preparation, treatments, and chemistry.

Full contact angle and surface energy datasets (including additional liquids and statistics) are available on our dataset hub.

Glass - DI Water
Glass - DI Water
Nylon - DI Water
Nylon - DI Water
PMMA - DI Water
PMMA - DI Water
Teflon - DI Water
Teflon - DI Water

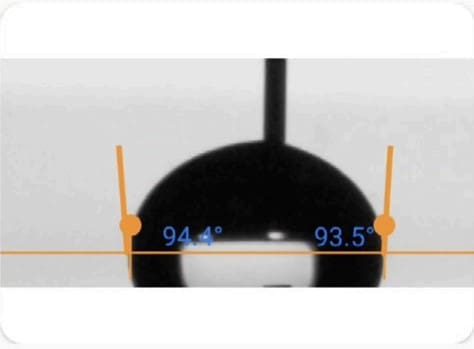
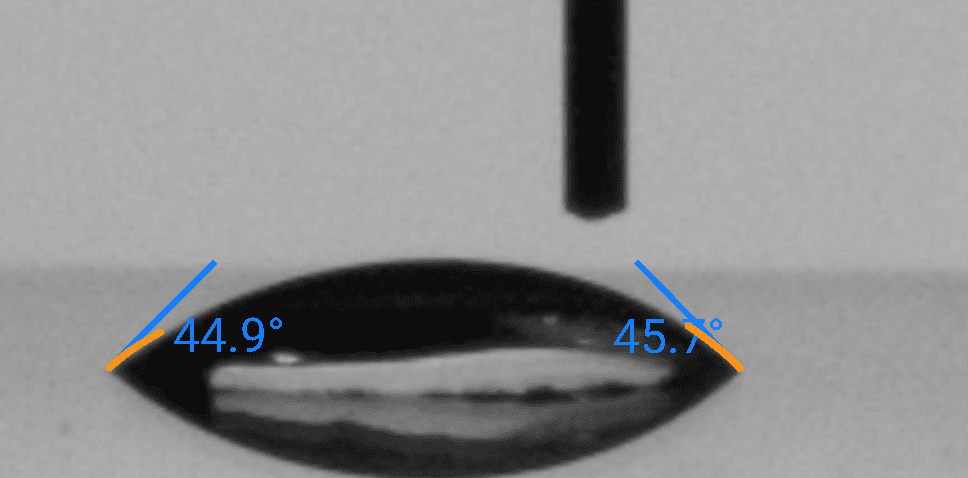
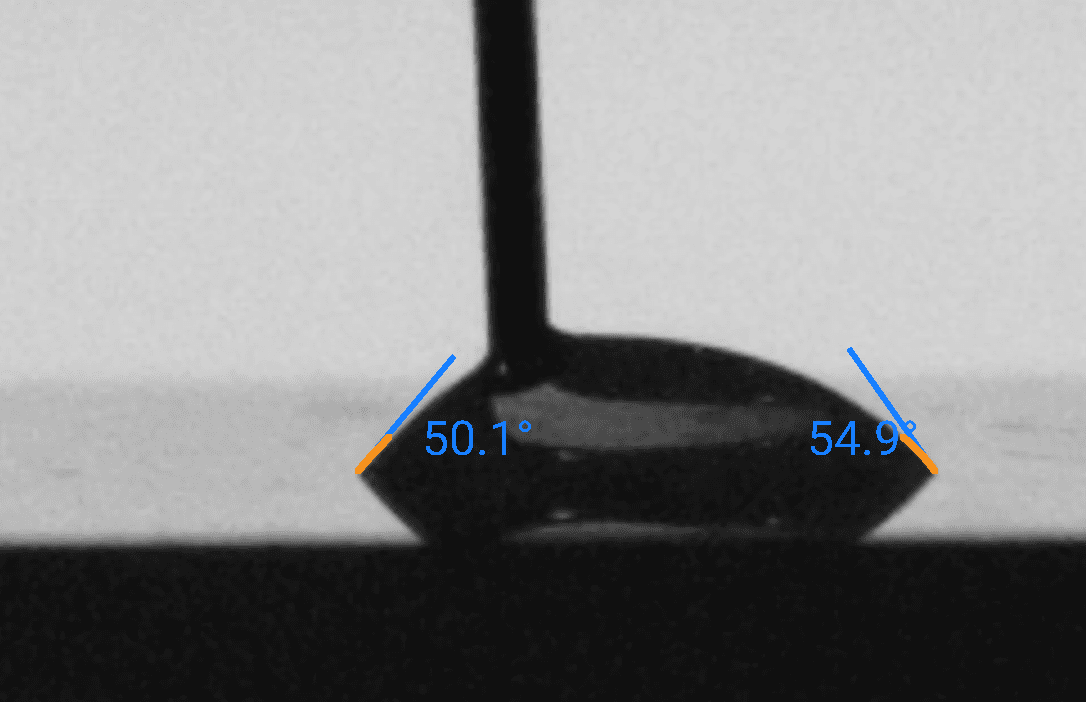
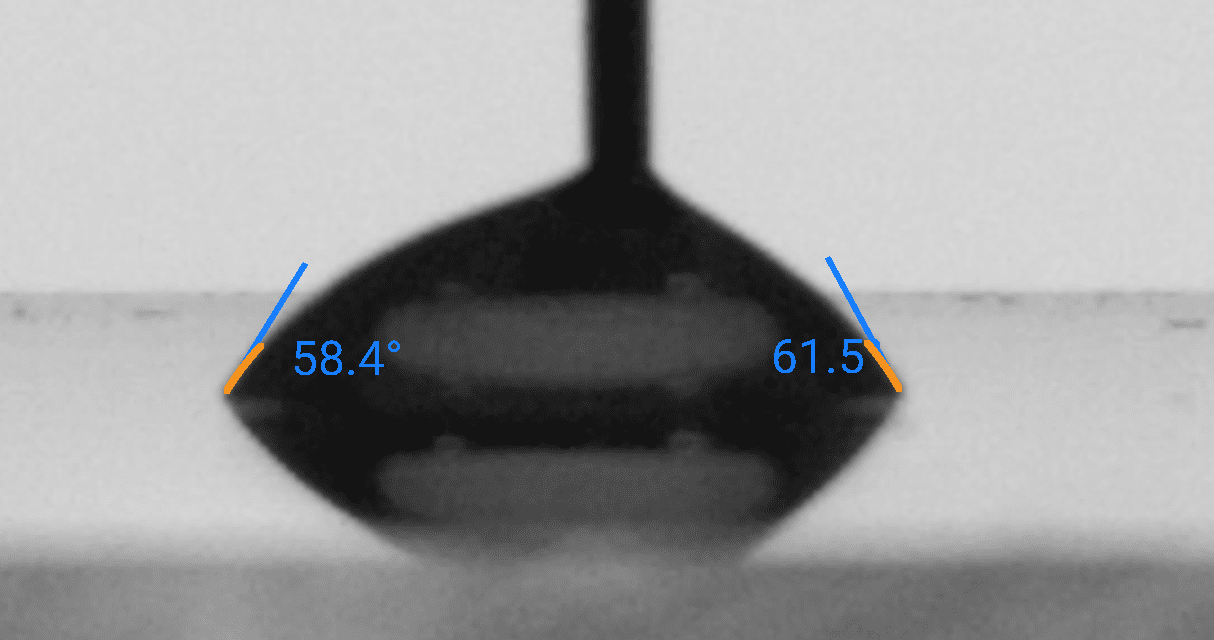
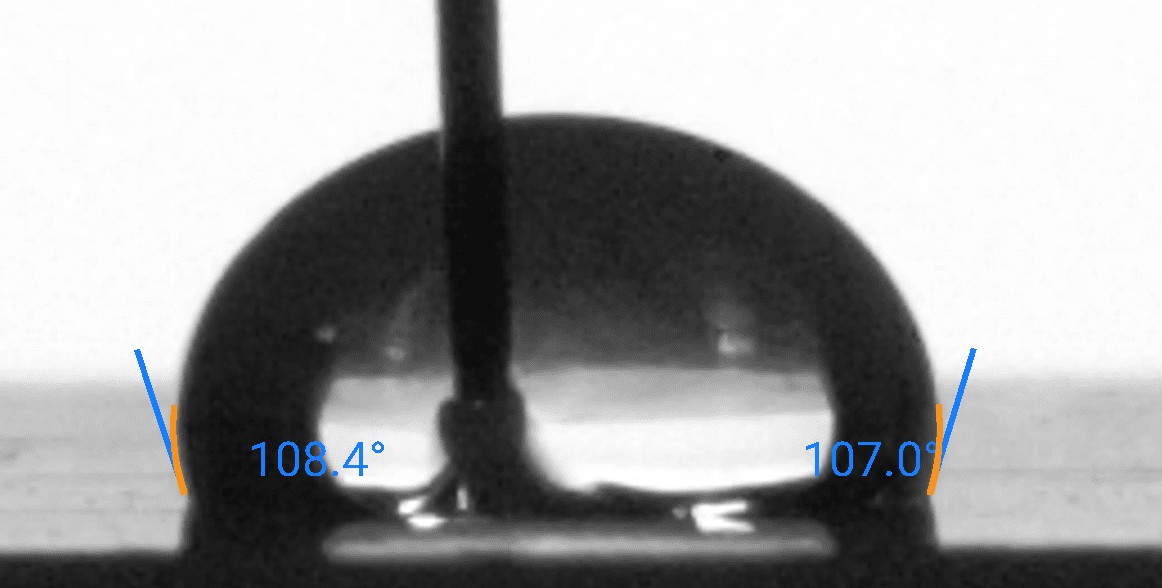
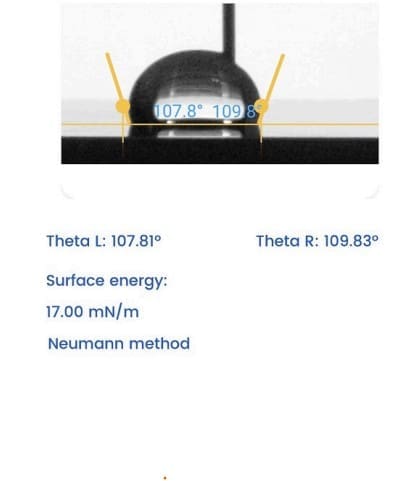
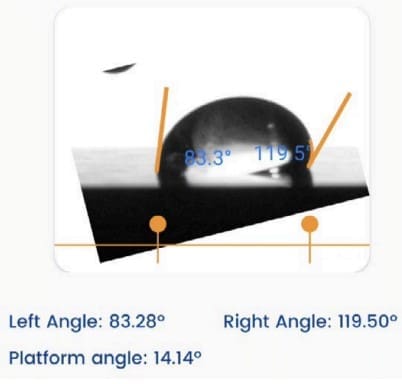
The droplet images above are taken from the same benchmark series as our open dataset. For each substrate and probe liquid we report:

● Advancing and receding contact angles (and hysteresis)
● Derived surface energy (SFE) values based on multi-liquid measurements
● Measurement conditions, uncertainties, and sample preparation details

Comparing your own droplet shapes and angles against these references is a fast way to spot contamination, treatment drift, or unexpected changes in wettability.

Chapter 3: Surface Tension Measurement

This property measures the force that acts on the surface of a liquid, aiming to minimize its surface area.

Misurazione della tensione superficiale

Sample Image taken from Droplet Lab Tensiometer

Dynamic Surface Tension

Dynamic surface tension differs from static surface tension, which refers to the surface energy per unit area (or force acting per unit length along the edge of a liquid surface).

Static surface tension characterizes the equilibrium state of the liquid interface, while dynamic surface tension accounts for the kinetics of changes at the interface. These changes could involve the presence of surfactants, additives, or variations in temperature, pressure, and composition at the interface.

When to use Dynamic Surface Tension Measurement

Dynamic surface tension is essential for processes that involve rapid changes at the liquid-gas or liquid-liquid interface, such as droplet and bubble formation, coalescence (change in surface area), the behavior of foams, and the drying of paints (change in composition, e.g., evaporation of solvent). It is measured by analyzing the shape of a hanging droplet over time.

Dynamic surface tension applies to various industries, including cosmetics, coatings, pharmaceuticals, paint, food and beverage, and industrial processes, where understanding and controlling the behavior of liquid interfaces is essential for product quality and process efficiency.

Learn how Surface Tension measurement is done on our Tensiometer

For a more complete understanding of Surface Energy measurement, read our Surface Tension measurement: The Definitive Guide

Chapter 4: Surface Energy Measurement

Surface energy refers to the energy required to create a unit area of a new surface.
231

Sample Image taken from Droplet Lab Tensiometer

Learn how Surface Energy measurement is done on our Tensiometer

For a more complete understanding of Surface Energy measurement, read our Surface Energy measurement: The Definitive Guide

For benchmark contact angle and surface energy values on glass, nylon, PMMA, and Teflon, see the Open Benchmark Data panel above or visit our Dataset Hub for full CSV downloads.

Chapter 5: Sliding Angle Measurement

The sliding angle measures the angle at which a liquid film slides over a solid surface. It is commonly employed to assess the slip resistance of a surface.

sliding angle 1

Sample Image taken from Droplet Lab Tensiometer

Learn how Sliding Angle measurement is done on our Tensiometer

For a more complete understanding of Sliding Angle measurement, read our Sliding Angle Measurement: The Definitive Guide

Chapter 6: Real-World Applications

Within the Telecommunications industry, several case studies exemplify the advantages of conducting surface property measurements.

Antenna Performance Optimization Using Optimized Surface Coatings

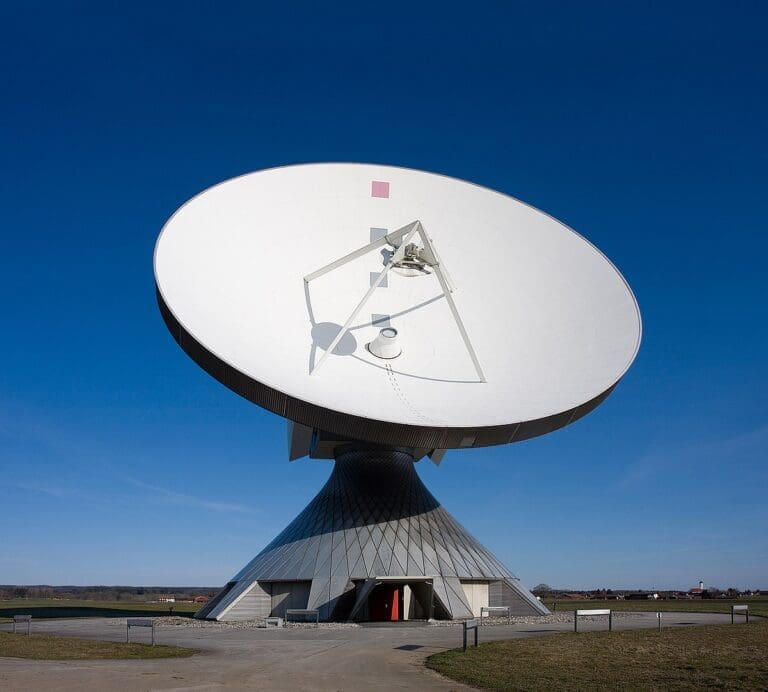
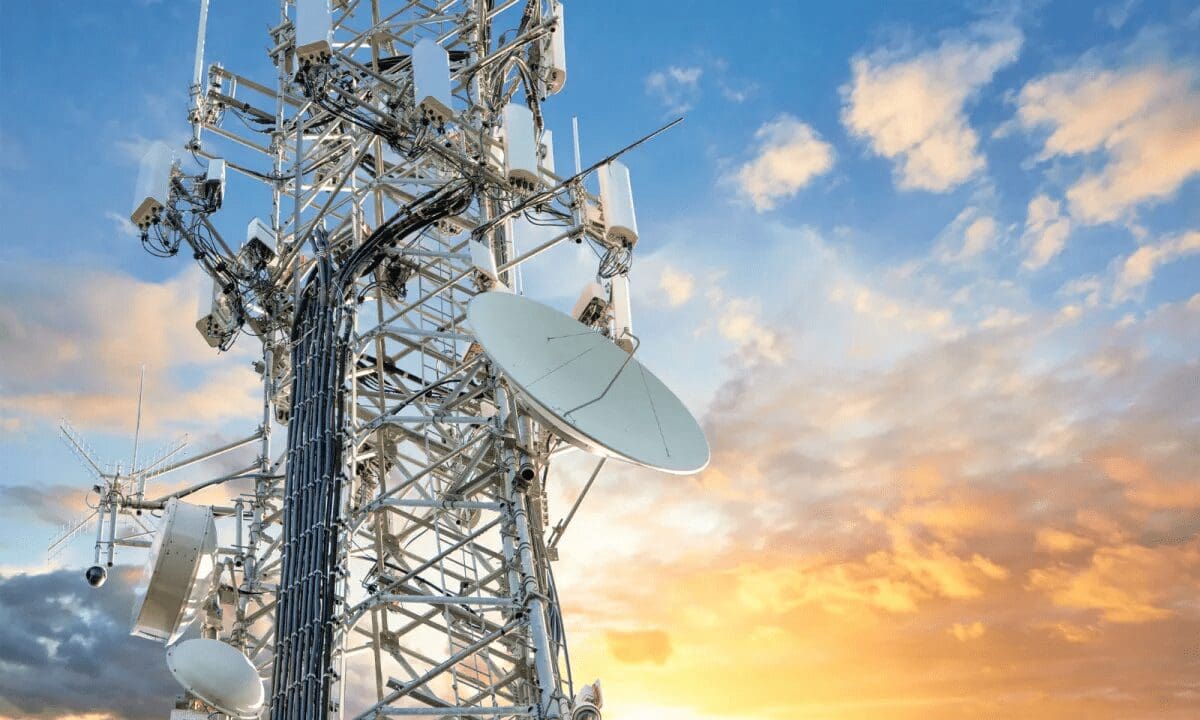
Challenge: Telecom companies face challenges with signal attenuation during heavy rain (rain fade) and disruptions due to ice and snow accumulation on infrastructure like antennas and satellite dishes. These issues can severely impact signal transmission reliability.

Solution: The company aimed to enhance 5G antenna performance under rainy conditions by developing superhydrophobic coatings. Through rigorous experiments with different coatings, they optimized contact angles to design surfaces with high water repellency. This innovation significantly reduced rain attenuation by preventing water droplets from interfering with signal transmission. As a result, the antennas maintained strong signal strengths even during heavy rain.

Moreover, in cold regions prone to ice and snow buildup on satellite dishes, the company conducted tests to identify superhydrophobic materials with large contact angles and low sliding angles. These materials effectively minimized ice adhesion, ensuring uninterrupted signal reception. By reducing the accumulation of ice on the dishes, they enhanced operational reliability and maintained consistent signal transmission in extreme weather conditions.

Antenna Performance Optimization Using Optimized Surface Coatings

Improving Cable Insulation in Humid Environments

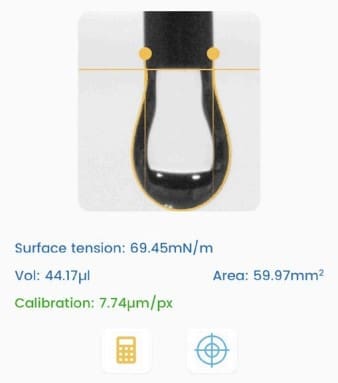
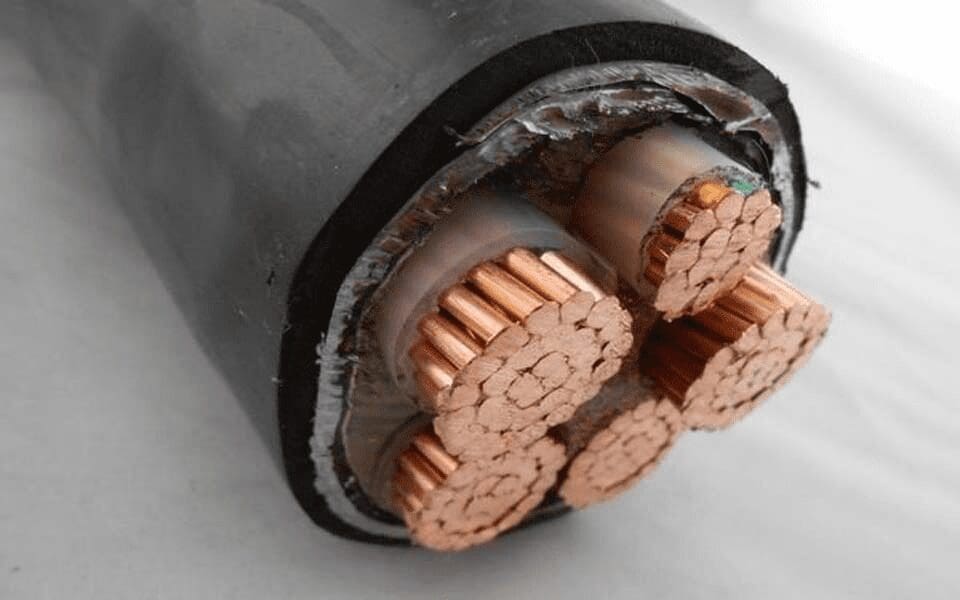
Challenge: Water ingress into cables affects signal transmission.

Solution: Optimizing the surface tension values can prevent water ingress into cables. Lowering surface tension enhances the water-repellent properties of cable insulation. A telecommunications cable manufacturer develops cables with insulation materials specially designed with low surface tension. This kind of modification will improve water resistance which will reduce the risk of signal degradation in humid environments and ensure the long-term reliability of the communication infrastructure.

Improving Cable Insulation in Humid Environments

Preventing Soil Adhesion on Telecom Infrastructure by Optimizing Sliding Angle

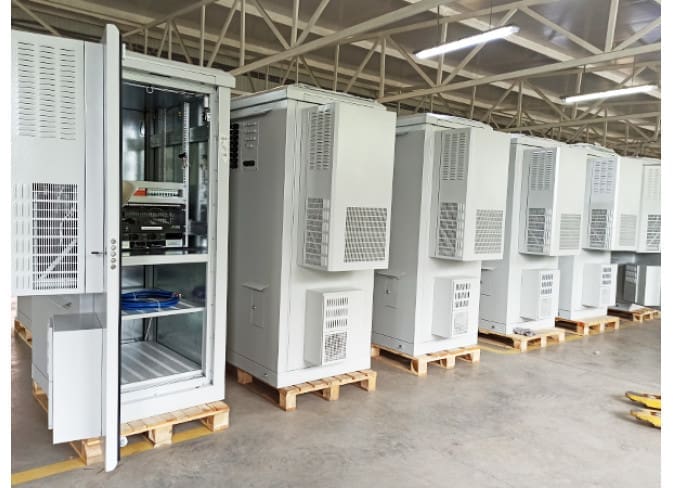
Challenge: Telecom infrastructure, particularly ground-based equipment cabinets, often face issues with soil and mud adhesion. This accumulation not only affects the aesthetics but also impacts the performance and maintenance of telecom components.

Solution: To prevent soil adhesion on telecom infrastructure, the researchers measure and optimize the sliding angle of equipment cabinet surfaces. By selecting materials or applying coatings that achieve a lower sliding angle, they reduce the tendency of soil and mud to adhere to the surfaces. This innovation facilitates easier cleaning and maintenance of the cabinets, ensuring that telecom equipment remains free from environmental contaminants.

Preventing Soil Adhesion on Telecom Infrastructure by Optimizing Sliding Angle

We are your partners in solving your Business & Technological challenges

If you are interested in implementing these or any other applications, please contact us.

Chapter 7: Standards and Guidelines

In an industry where precision reigns supreme, how can Telecommunications manufacturers ensure their products withstand scrutiny? The answer lies in standards and guidelines: the compass that guides them through the complex maze of quality and performance.

Conformal Coating Readiness Guideline — “≥38 dyn/cm” (PCB Cleanliness & Adhesion Readiness)

What it is

An industry readiness guideline that uses minimum surface energy (commonly ≥38 dyn/cm, i.e., ≥38 mN/m) measured immediately before conformal coating to indicate whether PCB surfaces are likely to wet and hold coating. It is best operationalized as a repeatable QC gate using fixed-time contact angle and/or computed surface free energy (SFE) rather than subjective dyne-pen interpretation.

When to use it

Pre-coating QC release (go/no-go gate)

Use right before the conformal coating station (or right after the final clean/plasma step) to prevent pullback/fisheyes/non-wet defects from entering coating.

Cleaning / handling / plasma verification & troubleshooting

Use as a trendable check to confirm washer/plasma stability and to pinpoint drift or localized contamination that causes intermittent coating failures.

In-scope / Out-of-scope

In scope
  • Immediate pre-coating measurement timing (defined maximum window; ideally at the station)
  • Defined PCB zones and structured sampling (e.g., solder mask flats, pads/connectors, selected component bodies/hand-contact regions)
  • Fixed-time wettability metrics (e.g., water contact angle at 1.0 s ± tolerance) and optional two-liquid SFE estimates
  • Replicate statistics and variability reporting (e.g., median + IQR per zone to catch localized residue “hot spots”)
Out of scope
  • Third-party certification or compliance attestation (this is a guideline/QC method, not a certification standard)
  • Direct measurement of coating liquid surface tension (measure separately if needed; this method assesses substrate readiness)
  • Uncontrolled measurements on rough/topographic features (vias, traces, edges) without defined “approved measurement zones”
  • Substitution for coating qualification (does not replace chemistry selection, cure validation, or full reliability testing)

Minimum you must report (checklist)

  • Board/lot ID + process context (e.g., post-clean/post-plasma) and exact timing relative to coating (“measured immediately before coating” or within a defined window)
  • Measurement zones + spot map (where on the PCB) and replicate count per zone (n)
  • Probe liquid(s) (at minimum DI water; if using SFE, identify the second liquid such as diiodomethane)
  • Drop volume and dispense method (single SOP volume, e.g., 8–12 µL)
  • Capture timestamp and tolerance window (e.g., 1.0 s ± 0.2 s) and any environmental controls recorded (if applicable)
  • Per-spot results and per-zone summary (contact angle values + median + IQR, or equivalent robust stats)
  • If used: SFE method + outputs (model used; total SFE and, if reported, polar/dispersive components)
  • Decision rule and disposition (Green/Yellow/Red thresholds used, actions taken, and any rejected measurements with reason)

Treat “≥38 dyn/cm” as a starting target that must be validated against your coating chemistry, board materials, and defect outcomes. Dyne level/wetting tension and SFE are related screening concepts but not identical quantities, so lock your SOP to one method and correlate to results.

How to interpret results (guardrails)

  • Timing and method discipline matter more than the headline number: compare only measurements taken at the same timestamp, volume, liquids, and zones, and always measure at a controlled point immediately pre-coating.
  • Pass isn’t just average, it’s uniformity: meeting the threshold on average but showing high IQR / patchiness by zone indicates localized contamination risk that can still cause de-wetting defects.
  • Low-energy / high-angle signals = escalation: if key zones fall below your gate (or angles trend worse), trigger re-clean/plasma/handling containment, then re-test before coating.
  • Optional cross-check for robustness: if coating liquid surface tension is known, confirm it is meaningfully lower than the substrate SFE (often cited ~10 mN/m lower as a heuristic), but rely on your site correlation data for final limits.

Now It’s Your Turn

We hope this guide showed you how to apply surface science in the Telecommunications industry.

Now we’d like to turn it over to you: 

Feel free to leave a comment below—we’d love to hear from you.

Leave a Reply

Your email address will not be published. Required fields are marked *


Scarica l'esperimento